
Note: This post was written by Jasmine Fleming, Digital Content Marketer & Strategist.
Who is visiting my site? What are they doing? Where did they come from? When do they visit my site? How are things working?

Kyle Akerman (photo via Twitter)
Content marketers need answers to these questions to consistently create valuable, high-performing content. Luckily, answers to these questions can be provided by Google Analytics.
Google Analytics measures data related to traffic sources, page views, and navigation flow (page-to-page movement). While it can produce hundreds of reports, Kyle Akerman says you’ll only need about 20% of them.
Kyle is a Chicago-based Google Analytics consultant. In a recent talk at the Bay Area Content Marketing Meetup, Kyle shared seven areas in Google Analytics you can start with to better understand your content performance.
Follow Kyle on Twitter (@KyleAkerman) and subscribe to his weekly Google Analytics newsletter.
1) Organic traffic trends
Looking at your organic traffic over an extended period can reveal trends in performance.
“Content marketing takes time,” Kyle said. “This isn’t like running paid ads where we can get leads in a day. Content marketing can take months, sometimes years, to have an effect, so you want to know which direction it’s trending so you can see if your strategy or execution is working.”
The best report to show this data in Google Analytics is:
Behavior > Site Content > Landing Pages
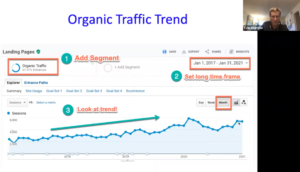
If organic traffic is trending upward, Kyle suggests that you keep following your strategy. If it’s trending downward, take a look at specific pages represented by the major dips of the chart to better understand the decline and how to improve your strategy.
2) Traffic champs
Traffic champs are your highest performing pieces of content, and you can see them in the same report you use for organic traffic trends. Just filter the data to the content types you want to examine (for example, blogs).
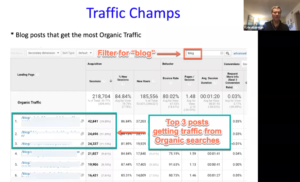
“Traffic champs are kind of like highways through your website,” Kyle said. “This is where most people are entering your site organically. You want to get your best billboard on that highway.”
To do that, he suggests you link to your highest converting pages, a lead magnet, or other strategic content. You can also regularly put your traffic champs in your social media rotation and newsletter to draw traffic.
3) Falling stars
These are once-popular pages that are now underperforming. It’s important to note these pieces because they’re still valuable, but they’re also causing you to lose site visitors.
You can view falling stars in any report by adding a year-over-year date range comparison and looking for the posts with the biggest drops in traffic.
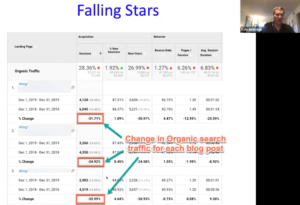
To get these posts back on top, Kyle recommends “rescuing” them by improving their quality. A few ways to do this are by adding:
- Images or videos
- Statistics or original research
- Strong opinions
- Contributor quotes
4) Search Console
This handy tool allows you to see the keywords that drove Google organic traffic to your site, and it also shows you the average search engine results page (SERP) rankings for relevant keywords and landing pages.
To view this data, you’ll have to connect Search Console to Google Analytics. Once you’ve done that, look for these reports:
Acquisition > Search Console > Queries
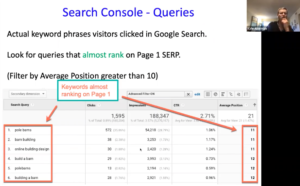
Acquisition > Search Console > Landing Pages
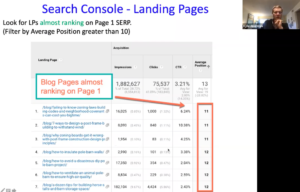
In these reports, entries with average positions 1-10 are on page 1 of the search results. Those with positions of 11-13 are close contenders for page 1 content. You can make tweaks to the content to boost your chance of landing on page 1, including some of the same efforts you use for boosting falling star content.
5) Campaigns
Studying your campaign performance reveals which categories and topics of content are resonating with your audience. It also shows you which traffic sources are performing best in the campaign.
To view campaign results, you’ll have to use UTM tags, or tracking links. Once you’ve set those up, you can see a high-level view of which campaigns are performing best with:
Acquisition > Campaigns > All Campaigns
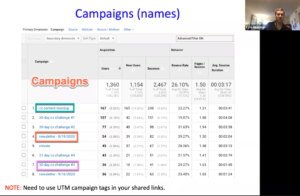
Within each campaign, you can also see the sources that led to the most traffic.
“Once you find your most successful campaigns, you know that content is working,” Kyle said. “Using the 80/20 principle, create more of that content around those ideas because people obviously like it and find it useful.”
6) Other content
You can also see performance for content such as videos, audio, PDFs, and quizzes. To see what other types of content are performing well for your business, you’ll need to set up events in Google Tag Manager. Once you’ve done that, go to:
Behavior > Events > Top Events
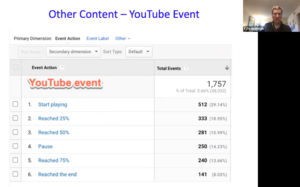
“These additional content event measurements are super important because video and audio can be expensive,” Kyle said. “You want to be able to track this stuff so you can prove to your bosses that they’re making a difference.”
Once you know what’s performing well, you can repurpose those topics across different content types.
7) Audience segments
Segmenting your data is the only way to get meaningful insights out of the jumbled mix of visitor sources, visitor behavior, and desired outcomes.
You have several options in Google Analytics for looking at audience segments. By default, you’re able to separate your traffic into organic, paid, referral, mobile, and new users.
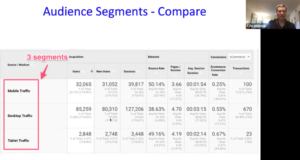
You can segment your audience in any report, and you also have the option to compare segments within campaigns to get a better idea of who is responding best to your content. Kyle recommends noting the content topic or type that works best for each segment and doing more of what resonates with each.
Making informed decisions with your content
“As a dashboard helps you drive your car, Google Analytics can help drive your content marketing efforts,” Kyle said.
Focusing on these seven areas will give you a great start to improving your content marketing efforts with data. This benefits your audience by providing them with helpful content while also improving your content marketing ROI.
On-demand recording
Watch Kyle’s recent talk at the Bay Area Content Marketing Meetup: